In this blog article, we will be looking at some ways that technology and big data can be integrated with maps to provide powerful systems able to help analyze the impact of climate change. Custom software tools offer insights on what measures are most effective to mitigate adverse effects on our planet. We have already seen how unusually pronounced droughts in one region contrast with devastating floods in others, supporting the common belief is that weather patterns are becoming more extreme. Scientists estimate that there is a tipping point beyond which it would be very difficult to reverse path, and we are quickly approaching this mark. Many estimates predict that in order to pull back from the precipice, global temperatures must not exceed 1.5°C above preindustrial levels. This requirement presents a difficult task to cut world emissions by 2030. As governments start to acknowledge the risks, we now see large scale studies drive new innovation and legislation. The data that is produced in these studies can work with interactive maps to give users and scientists different perspectives and options to interpret what is occurring on our planet. There are many ways to create such custom maps, and in the article below we propose ideas from past projects.
Category: map reports
Export Tool to Make a Map for Business Presentations
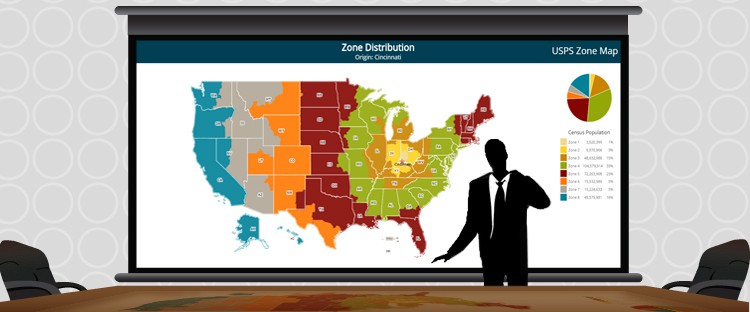
Web-based mapping solutions don’t always combine well to offer great presentation tools for business professional requiring the ability to make a map. The dynamic side of the map is designed to be streamlined and highly optimized to run efficiently on all web devices and wireless networks. Traditionally these maps are products that get embedded in the HTML of a website or intranet and would be used to transmit information primarily to viewers of the specific page on which the map was hosted. However, in many circumstances there is also a need to include highly visual static maps as part of presentation material, whether used in PowerPoint presentations or slideshows. These alternative types of maps require some of the data included in the dynamic maps with the ability to also include informative static headers and footers.
Using jQuery Maps to Generate Better Business Reports
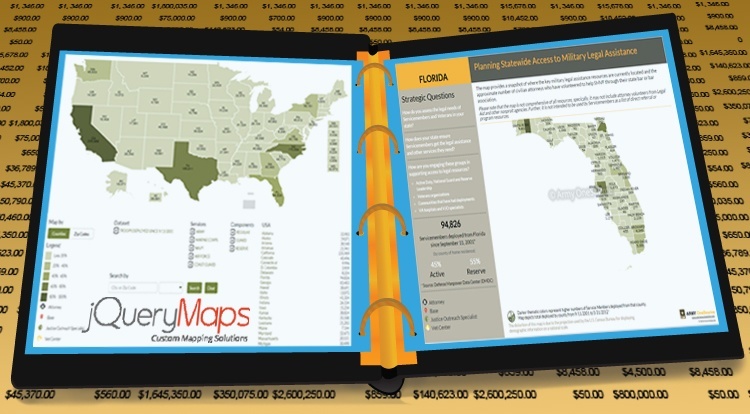
Transmitting information in a concise, well-organized and intelligible fashion is important to any company and industry. Whether as a requirement for weekly sales, quarterly profits or annual profit/loss balance, reports provide fundamental insights to our day-to-day business. Facilitating the ability to generate business reports and enhancing their appearance is fundamental to most data-based software. With this idea in mind, we are presenting a list of the different options available and the implementations that have worked successfully for our clients.


