Keeping up to date on commodity pricing can be a challenge for even the most efficient companies. Prices in volatile products can shift daily or even multiple times a day and staying on top of these tendencies is an important service that sales teams must provide to their clients. In this blog we will discuss a tool that was developed to address this specific need in order to provide accurate information to en entire sales team via a custom US State map with an incorporated admin tool. The end result is a highly sophisticated software that enables sales team to inquire on prices, update their own information based on quotes received and universally log all of the entries to later generate detailed reports by sales members, product and location.In this article we will use the recent project developed for New Balance Commodities as a basis for the discussion on how a custom States map can be linked to a database and admin to manage and display prices for sales teams. The same design can be applied to any industry and any aspect of the software can be personalized to fit the exact needs of any company. We will be discussing the following important points in this article.
Benefits of Using a JavaScript map as a Platform to Store and Display Prices
Ability to Share Information Instantly on an Interactive Map of the US
Custom Map Display for Easy Access to Information
Key Benefits of Linking Dynamic Data with Custom Maps
Why Use a US States Map to Store and Access Sales Information?
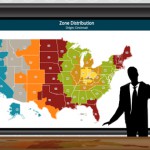
 There are numerous ways that sales information can be displayed to a sales team, whether in tabular Excel sheets or shared Word documents. However when the sales information is linked to a geographic area, there is a key advantage to projecting the data on a US States Map or other geographic interface. See example sales related map. In the case of our recent development produced for New Balance Commodities, all products were linked to a specific number of plants located across a territory map in the mid-West. In this case it was beneficial to display information graphically in addition to traditional tabular approaches, as a way of providing their sales team with a clear and more efficient tool.
Plants are Geographically Plotted on a US Territory Map
 The list of plants and the products carried by each plant are constantly evolving. As such, the project requires a high-level of flexibility to accommodate changes in the data and in the regional view. The map was created to initial focus on all States with active plants, although the scope of the cartography is of the US States. This custom initial view is regional and expands automatically as new filters are applied or as new plants are added to the project. See sample of this feature. This process occurs completely on the backend and users only need to add information using the admin interface that we will discuss below. Since prices for products are linked to locations, being able to filter for a specific product and possibly even a price range for said product, provide visual results plotting all plants that fulfill this criteria. The same information is also given to sales teams in a tabular fashion below the map in the custom results tables which usually list prices in order of date, amount or by product. This combination is an excellent method of visually plotting results on a custom territory based on a specific search while also offering a tabular breakdown of the information. Clicking on the list below or on any of the icons, provides more details about the products and pricing for the specific location.
Prices are Associated to Cities on the Regional Map
 Each plant plotted on the map is linked to a geocode which is automatically calculated based on the address for the location. Adding or editing locations is done through an admin for ease of use and can be updated within a minute. Prices are also displayed by type of commodity within a pop-up box once any location is selected. In the case of the example above, jQueryMaps generated a tooltip box that is called when hovering over a location to show the two most recent prices, while the 5 most recent prices for each product are displayed once the location is clicked in a fixed pop-up box. Since some plants carry a large list of products, the project benefits from a collapsible list that displays the 5 prices for each product only once the header is selected. This is a simple yet important tool to organize information visually within the project. Since prices are linked to cities, the application can also interact with filters and show or hide icons based on a type of search. Filters are highly customized and can be adapted to meet the exact needs of any sales team. See custom pop-up box example.
Easy Interface for Interactive Map Data and Generate Database Exports and Reports
 An important highlight of using a map system enter and view prices within a US States Map is simplicity. The ability for a sales team to have immediate access to the most up-to-date prices provides them with the necessary information to make decisions and keep clients informed. The ability to use a map interface to select on plants and update prices is a quick two click process which means that time is not wasted sorting through emails or documents to view the latest quotes for a product.
What capabilities are available with the custom map tool?
The tool that we developed included a number of important features designed for all members of the sales team. These items include a login page that registers the email of the sales team user that is accessing the system. This is used to track what prices the particular user has inserted to the US States Map. This tracking can later then be used when generating reports or to filter by information for a particular sales member. Another important feature is that the map automatically refreshes every Sunday at 12am to set all of of the plants to a default green color. During the week, as sales members update the prices, the colors of the icons change automatically to indicate where updates have occurred. This is an easy way to detect where the most recent prices are coming from on the map. Probably the most important aspect of the product is the ability for the information to be visible for all sales team users and updated instantly once changes are made. This provides companies with the key to apply changes quickly and instantly update clients on shifts in prices.
Contact us for a free consultation to view the product that was created to manage commodity prices on a US States map.
Share the post "Efficient Tool to Manage Sales Team Pricing with a US States Map"


