Product
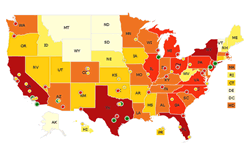
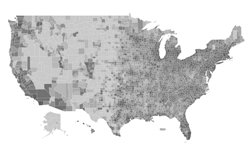
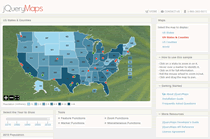
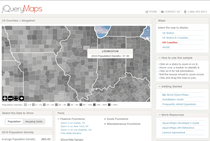
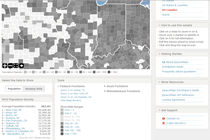
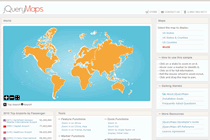
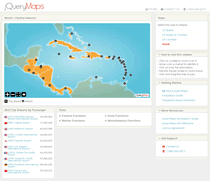
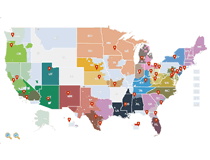
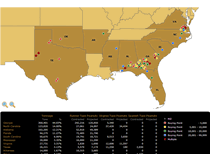
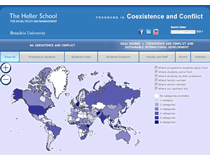
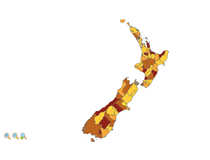
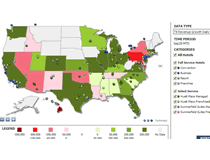
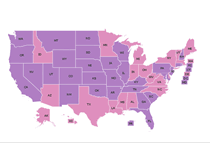
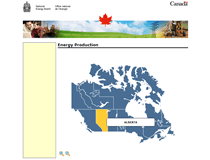
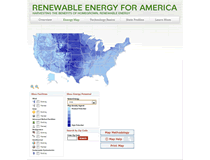
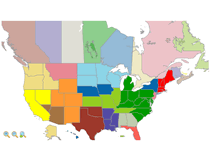
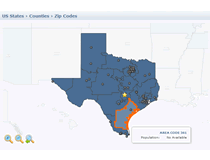
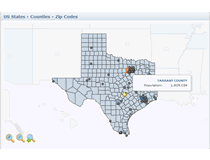
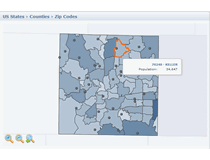
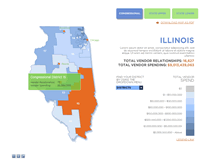
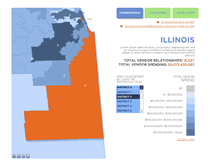
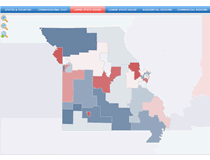
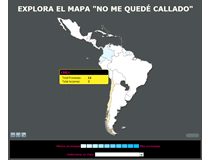
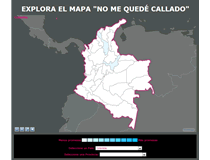
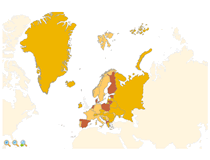
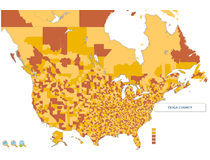
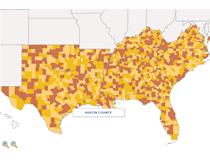
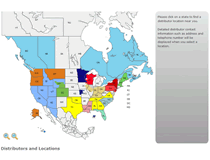
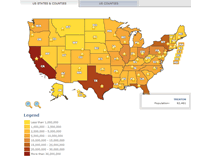
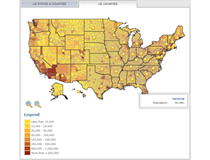
HomeColor code areas or plot your database listings on a fully customizable and interactive map of the world, continents, countries, states, counties, townships, congressional districts, zip codes, area codes or any other regions you need to map (even custom ones).
jQueryMaps is a whole new approach to interactive maps. Our map tools are designed to provide great vector graphics, dynamic navigation, and an extraordinary user experience without the restrictions of Flash.
This means that jQueryMaps can be used on any device: PCs/Macs (Chrome, Safari, Internet Explorer, Firefox, Opera...), tablets (iPad, Android, Windows…) or smartphones (iPhone, Android, Windows, RIM…). The map just uses standard JavaScript, jQuery and HTML5(1) to run. It’s that simple!
We provide professional turn-key mapping solutions, not just do-it-yourself software. Our unique map tools let us take care of
everything, including
the map engineering, the cartography, connecting with your existing database and website, and developing any custom functionality
that may be required.
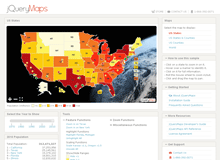
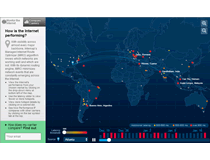
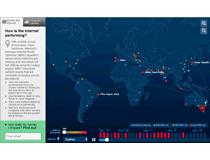
Visit our showcase to see jQueryMaps at work.
(1) As you probably know, Internet Explorer 8 and lower do not support HTML5. To overcome this situation, we use Google's Explorer Canvas to transparently convert HTML5 vector graphics to VML (Internet Explorer propietary vector graphics), which enables jQueryMaps to work perfectly well on old versions of Internet Explorer.
| Features | Benefits |
|---|---|
| Connect live with your databases / Live connection with your databases. | Show all your information in real time. |
| Color code features or group of areas. | Visually identify features by category or relevance. |
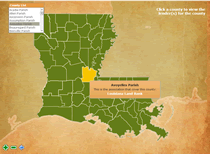
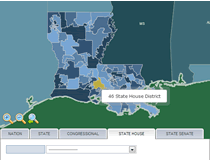
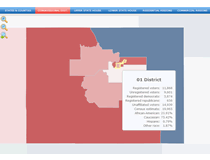
| Pop-up summaries on mouse over. | Obtain information pertaining to each feature. |
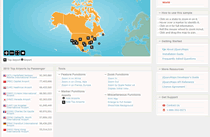
| Show markers. | Show live icons on the map representing your offices, points of service or places of interest. |
| Turn-key solutions with superb support. | We provide all of the map engineering, cartography, database connections and other requirements to get your project running. If you prefer to do the integration yourself, you can always contact our technicians for one-on-one support. |
| Connect to external pages or JavaScript functions. | Click on any feature or marker to go to a specific page or to call a JavaScript function. |
| Select several features. | Call a JavaScript function sending the list of selected features. |
| Highly customizable. | Customize your color schemes, popups, icons and much more. |
| Download and host on your servers. | There isn’t any dependence on third parties. |
| One map with several themes. | You can use multiple themes, with different colors schemes and behaviors, to convey different types of information. |
| Universally compatible. | Works on virtually any device/browser. |
| Fast delivery. | Have your system up and running in a few days or expedited within hours. |
Our map tools let us provide robust yet flexible mapping solutions. jQueryMaps consists of a set of JavaScript classes that you instance and interact with from your own JavaScript code. jQueryMaps classes make use of the jQuery library and it should be included in the page/project header. jQueryMaps.Map is the main class for creating a map, and the only one required in most projects. The rest of the classes provide utilities and structures to create the data straight from your JavaScript code, instead of loading XML feeds.
In order to display a specific map, jQueryMaps simply uses a background image (in PNG, JPEG or GIF format), a set of features (the polygons or lines that color code the map) and an optional set of markers (landmarks placed on top of the map). All of these components will be provided with your project.
There are two ways to use jQueryMaps:
- Having it load data from XML feeds. This is the most common setup for jQueryMaps.
- Creating the data straight from your JavaScript code. This can be useful in specific cases.
Find more information about the API, the XML feeds, instancing the map, examples and much more in the jQueryMaps’ Developer’s Guide.

